Positive news for the job market as jobless claims fell hard, but it was the NASDAQ 100 closing at an 11 year high that stole the show. Yes, it is positive claims almost broke through the -300,000 level and the market certainly liked the figure. Even a slightly negative Philly Fed survey couldn’t hold back buyers from scooping up shares throughout much of the day. Volume on the NASDAQ rose again, but once again over on the S&P 500 volume fell. The S&P 500 continued its “wedge” higher as the NASDAQ remains the leading index.
The number of bulls pulled back from last week’s high, but bulls registered at 47%. Bears were able to climb back above 20%, but they didn’t make a big stand. The II survey continues to be bullish, but well off the extremes we witnessed early this year. I wouldn’t consider this market at an extreme level as far as sentiment is concerned. And with the amount of stocks we continue to find popping up this rally should have legs to run for quite some time. Again, we may see a shakeout here and there it won’t derail the rally currently underway.
Every rally will trick traders/investors to chase stocks at highs only to see the stock reverse and shaking them out. It is best to have a sound approach to buying and chasing stocks SHOULD NOT be a part of the approach. Just as important is money management, knowing how much to buy, cut losses, and exit a position is paramount. Without these tools you will be left behind.
It is clear the NASDAQ is the leading index with S&P 500 and Dow Jones Industrial lagging behind. This is precisely what we like to see. If it were the other way around, we’d have issues. Enjoy the weekend!
Thursday, January 19, 2012
Wednesday, January 18, 2012
Stocks Close Higher Again above October Highs
Another stellar day for the bulls as stocks rose across the board. The S&P 500 closed higher for the 10th time in 13 sessions but volume fell on the index. For the NASDAQ composite the index closed higher with higher volume and it was above average. Clearly the NASDAQ is the leading index of this current rally a sign we’d like to see. Given the run up as of late, it is hard to continue to knock the ball out of the park each and every day. Use the opportunity to cut laggards and stay on your winners. Today was just another solid day in this uptrend.
The market really got going with a big jump in home builder confidence. Finally, after so long we are beginning to see an uptick in confidence from homebuilders. It remains to be seen whether or not this translates into success, but the way homebuilders are acting higher prices are ahead. Banks were helped out as well, with an improving real estate market the situation should translate well for the “toxic” assets banks continue to hold. Let’s not forget the Federal Reserve holds quite a bit of mortgage paper and continued improvement in the real estate market will surely help the quality of paper held on the Fed’s balance sheet. It all boils down to price and volume and it is positive.
I am still looking forward to seeing Sentiment indicators tomorrow. Most notably the AAII survey as it has been quite bullish for the past two weeks. Bears have been decimated below 20% and you have to wonder if this market will have a quick washout to get the weak bulls out of their positions. This would be an ideal situation for us as it will show who the true leaders are in this rally. It would then allow us to focus in on the very best and take advantage of a new rally. Sentiment is an imperfect indicator and usually works best at REAL extremes. I highly doubt we are at one now, but we are at a point where it’d be nice to shake out some weak bulls then proceed with this nice rally. Remember October of 2010 and November of 2010? Quick shakeouts only to have us lead higher. Don’t be easily shaken out, follow the game plan.
Tuesday, January 17, 2012
Rally Fizzles as Volume ends Mixed; NASDAQ gains but well off the highs of the Session
The morning started off great for stocks, but the day’s gains were unable to grow. Fresh off a long weekend it appeared overseas markets were brushing off S&P’s downgrade of 9 Euro nations. Little ground was covered for much of the session as the market traded within a relatively small range. A few stocks broke out including MSFT and PNRA. PNRA held onto most of its gains MSFT could not. The days action really boiled down to stalling action on the NASDAQ. In of itself, today isn’t that bad, but over the next few days looking out for distribution will be a key indication if this market can power forward over the next few weeks.
Today’s market action isn’t a glaring sell indication, but it does just raise a simple flag that the market may be acting a bit tired. We have plenty of stocks underneath setting up and looking solid. This doesn’t mean we automatically blast higher, but it does help our chances over the next few weeks/months for this market to set up for gains. For now, it appears the general market has been able to shrug off the negative news pouring out of Europe as of late. I should mention at the end of February Greece is set to default again. Don’t fret, have a game plan and execute it with precision. Big Wave Trading has a plan and we’ll continue to execute.
CNBC continues to harp on the “golden cross.” They did a piece when the Dow Jones Industrial average experienced the cross. Now it is the NASDAQ’s turn and there is a bit of history to back it up. I posted the numbers awhile back and confirmed with 80% of the time you will see gains 180 days from the actual cross. It is quite bullish and I wouldn’t be against the golden cross as history has shown it is a profitable indicator. Given the stocks we are seeing, coupling the golden cross buy signal can set up for a very bullish spring. Stay tuned.
It would not come as a surprise to use for the market to shake out weak bulls. Last week the number of AAII bulls nearly topped out at 50% for the second straight week. Normally, we tend to see shakeouts happen when the retail investor gets a bit too bullish. We are going to follow our rules as usual, will you be able to handle a market shakeout?
Wednesday, January 11, 2012
Market closes mixed with declining volume
The NASDAQ closed higher for the 6th time out of 7 days as volume continues to remain above average. Today appeared on the onset it would be a day of consolidation, but the NASDAQ would have none of that. While volume remains above average for the NASDAQ the S&P 500 continues to remain below the key volume moving average. A sign Institutions are more interested in NASDAQ composite stocks than the S&P 500. A pull back is certainly in the cards and would be a welcome sign to consolidate the recent gains. However, our trend remains up and until this situation changes we are positioned accordingly.
Tomorrow we get a bit of economic data in the morning and it will be all about retail sales figures. Forecasts are for sales to jump .20% and I wonder to myself: “do economists ever get anything right?” They don’t, it is meaningless to position yourself based upon a hunch or opinion. NO ONE knows the future we only know what we know up to a point. Sure, fiat money has an average shelf life of 35 years, but it doesn’t mean the US Dollar has to end (in one form or another) 35 years to the date Nixon took us off the gold standard. The moral of the story: price and volume tell the story you want to be listening to; follow it!
January always tends to be a tricky month for stocks. Sure, optimism runs high for the new year and as humans we tend to have emotional roller coasters and makes sense for stocks to run at the beginning of the year. However, January tends to be more of a messy month for stocks and it is quite dangerous to think live on hope of a good year. Have a game plan of how you plan to attack the market and execute the plan. There is buying going on underneath, we are finding them and you need to have a game plan to attack those names.
The key to success is using a cut loss strategy to protect your downside. It is always important to cut your losses and move on.
Saturday, November 26, 2011
Big Wave Trading Portfolio Update
It continues to be a rough 2011, minus the July to August downtrend, but it is possible another trend is in the process of developing. Following the rally off the October lows, it started to look possible that a new uptrend might take shape as some new CANSLIM quality stocks started to build right side of bases with some breaking out. On top of that, some very pretty green chart patterns began setting up in more speculative quality names (SIMO PKT) with the stocks coming off the lows producing some solid gains fast (PEIX BIOF). During this uptrend from the October lows two partial buy signals were produced with both failing immediately due to the signals coming very late in the uptrend during overbought conditions. While this was occurring, ex-generals of the previous uptrend from the 2008/2009 lows were not participating in the rally. These two major red flags prevented a full buy signal from being produced the whole rally saving Big Wave Trading investors money by keeping new long positions very small in relation to total account capital.
Since November 17th, things have changed. Bank stocks that looked to have been trying to hammer out a bottom have completely rolled over with stocks like BAC and GS hitting new lows, the new CANSLIM quality long setups (VMW TIBX SPRD RHT) have failed immediately, the speculative longs have reversed hard/crashed (LGND OPNT GMCR), the inverse ETFs have come under heavy accumulation, the 3x bull ETFs have come under heavy distribution, the ex-generals (AMZN AAPL PCLN CRM) have all created very bearish chart patterns (most have H&S tops), and the SP500 and Nasdaq have resolved themselves below the triangle pattern they were creating in November. All of this threw our market model into a 66%-75% sell signal on November 17th.
This signal has proven quite profitable in the very short term but it remains under a 66-75% signal and not a 100% sell signal due to the fact that volume on the NYSE on the distribution days continues to be below the average daily volume of the past 50 market sessions and we still have some current long positions that are holding above key support. If the market can rally on the short term and fail at recent resistance levels on higher volume, a full 100% sell signal will be triggered (despite above average volume or not on the NYSE). The nine long positions that remain in the margin account (4 in the IRA) are all on the cusp of triggering their final cut losses. If this happens, along with the NYSE failing at resistance (even if volume is lower than the day before), then the model will go 100% sell.
Currently, the Big Wave Trading margin account is 55%-60% short 10 stocks, 10-15% long 9 stocks, and 25-35% cash. The Big Wave Trading IRA account is 70% long 4 inverse ETFs, 6% long 4 stocks, and 24% cash.
Top Current Holdings – % Return – Date Of Purchase:
EDZ – 23% gain – 11/18/2011
Monday, February 14, 2011
My Interview With The Rouge Investor Website
I had the chance to re-interview Josh Hayes from Big Wave Trading in an effort to learn about his methods to consistently profit from trading stocks. Let me stress that Josh does what I consider to be an art and he is one of the highest performers around. I’d argue he is mainly a momentum investor, mixing technical and fundamental analysis to achieve superior returns.
There are two options for getting more information about Josh and his analysis. First, he has a premium subscription service at BigWaveTrading.com with different membership levels for different needs. Second, he has BigWaveTrading.net which is a site dedicated to free commentary. Check them out!
We started off getting revised answers to the questions I asked in my previous interview and then moved on to a new set of questions.
Interview 1.0 Revisited
How would you describe your trading system?
Simple without noise. I simply pay attention to my charts. I don’t watch CNBC or read other financial publications. I do not even subscribe to IBD anymore. I just use Daily Graphs, Telechart, Scottrade, and IB. I keep it very simple and the most important thing is I never “try (it’s impossible to do)” to let my stupid opinions influence me.
How has your trading system changed, if any, ever since the economic downturn?
No, It hasn’t. I started looking at charts in 1996 and in 1999 I had learned-in-my-head the CANSLIM methodology and have kept to that simple (yet very hard to initially learn) methodology since 1999. I know and knew, thanks to my laborious reading of about 100 stock market books, that nothing ever changes in the stock market but the players. The patterns always remain the same thanks to basic insecure human emotions like greed, fear, and hope. They are completely useless in this game.
I noticed that on your telechart, you keep your price very small compared to most charts. What is you reasoning for such a setup?
It allows me to, very, clearly see the basing patterns such as a cup w/ handle, cup, ascending, double bottom, or HTF pattern. By “squishing” the price the chart goes from big and what appears to be loose to tight. If a stock is not completely tight on my price settings I know I want to avoid it. Visually, it is just what I prefer. To someone else, it might not be their cup of tea. To each their own.
Is it an advantage or disadvantage to be located in Maui?
If we are talking about surfing, YES! If we are talking about life, YES! If we are talking about the stock market, YES! Maui no ka oi. Being so far away from NYC and CNBC has to have nothing but 100% advantage towards my investing. Getting rid of all that mainland noise is the reason I can completely be objective towards the stock market. I never know what is happening in the macro environment anymore. I could care less. It’s all about sun and fun for me and that equals profits thankfully. Once again, I say, for me.
About how long did it take you to get to a level where you could make consistent profits?
Four years (1999 was too easy and we will never see that again in our lifetimes). 2000 was the first year, when the market tanked, and I beat the market by 1000%+ that I realized that I could do it. I have always beaten the market returns but trust me the market still beats me at being very difficult. I can not stress enough how difficult this really is. If you do not get any luck and have only skill in the stock market, you will not make money. You seriously need skill and luck. Since I have no luck, I am very fortunate to be beating the market every year since 1999.
What single piece of advice would you give to personal investors as we all fight to find and keep profits?
Never give up. Either you have it or you don’t. If you struggle for 10 years and are still interested TRUST ME in 20 years you will be very wealthy. However, wealth will never equal happiness. Live and love life. Have fun. Make sure you do what you love. If you do not love this game do not do it. Honestly, I hate this game so much that I love it. But if someone asked me “surfing or stocks?” The answer is simple and I do not even have to think about it. Surfing.
Interview 2.0
To start off, would you highlight your average return on a position, your success rate (% of stocks from which you profit), and the size of your average position in dollars?
All of that information can be found here. I was tracked by a subscriber in an excel spreadsheet going over my purchases and sells over the past year.
We’ve seen a bull market with significant gains since the bottom in early ’09 (Dow). What do you expect from the market in the coming years? Also, do you subscribe to IBD’s method for determine market trends?
I can not predict the future and never will try to. Nobody knows what will happen in the future and when they say they think this-or-that will happen it is completely ego driven and they want to be seen as “important and smart.” The truth is, nobody, and I mean nobody, can completely look at all the data and be correct about the future. It is a total crap-shoot. I play the now. I live in the now. There is no room for the future. It is what it is and that is that. Also, 130 years of data of facts proves that IBD’s way of determining market trends is correct. However, in all fairness, I think some of the writers of IBD might not be investing money in the stock market. They don’t have what I would say is “the touch.”
I’ve been studying the articles you’ve written about your trading strategy (which I will include links to) and was curious if you are still using the same chart setup? (The setup consisted of price with a moving average up top, volume and TSV in the middle, and BOP, MS, and RS to the S&P 500 in the bottom.)
To keep it simple, yes. The same setup I’ve had since 1999.
Click to Enlarge.
Using your chart setup, what exactly to do you look for that triggers a buy or short signal?
Volume, price, and BOP. Just like always. Big volume, a clear breakout/bounce, and heavy BOP either to the upside or downside.
Do you have a written/typed checklist of some sort that you follow when trading?
No, it is all in my head. The routine is like breathing. You just do it at this point.
How do you determine the point when you take profits/limit losses? Do you have an exact system for exiting positions?
The chart tells me what to do. Sometimes you get it right and look like a genius. Other times you get it wrong and look stupid until you get it right again and look like a genius. I take every buy/sell signal from my charts. It’s definitely more of an art than a science. I laugh at most “mechanical/black box” systems.
Do you add to existing holdings? If so, what is your strategy for this.
The chart. It is all about the signal. Breakouts/bounces on volume. I have added to positions on pullbacks in my IRA in high-priced CANSLIM quality stocks but it must be coming right off the 50 DMA on volume with a very low risk to possible reward.
How about ETF’s? Do you stick to stocks or have you started to trade other securities?
Only stocks. No ETFs. Not the same ballgame. Lazy man’s game.
Lately, I’ve started to add the IBD composite score as a screen component (only going long companies with a score of 80 or higher). Do you have a level of fundamental analysis in your system? Does share price influence your picks?
Share price and quality of fundamentals matters everything. I don’t care how nice the chart is, if fundamentals are not there, it will be small. An ugly chart but making a clear move with fantastic fundamentals will always beat a perfect chart with ugly fundies.
What would you say was the tipping point when you transitioned from an amateur to a professional?
That will never happen. I am and always and forever will be an amateur in this game. You just got to cut losses and learn your history and have amazing patience for learning. This is the hardest “game” to ever play and win at. Harder than blackjack, harder than poker, and harder than almost anything you can think of.
I want to thank Josh for his time and help in putting this together. Much appreciation! Again, if you would like to get in touch with Josh or get more information check out his site, BigWaveTrading.com.
Monday, January 03, 2011
Stocks Rally On Higher Volume Following The Light Volume Holiday Trading
While MarketSpeculator/BigWaveTrader is on vacation on my stomping grounds of Maui, I will fill in with some brief comments, until he returns. — Josh Hayes
The market had a very strong session today and despite finishing off the highs overall it was a great day. The biggest positive of today is two fold. For one, my current holdings had a fantastic day with the biggest CANSLIM positions having some of the bigger gains. Second, my main long scan is full of stocks. These two events tell me that today was a great day, despite us finishing off the highs.
For those of you familiar with me, you know that I do not read or watch anything anywhere on the stock market. I simply use charts on the indexes and individual stocks. When I see a chart pattern that is extremely bullish based on the past 130 years of historical data about the markets biggest winners then I dive a bit deeper into the fundamentals. However, when it comes to macro events, I could care less. When you live on Maui and have made your living via charts the past 12+ years, you realize more and more everyday what a pile of junk most traders infect their brains with.
The bottom line to that is that if you are looking for a “reason” as to why the market did what it did today well I can’t help you with that. If you are looking to make money on the actual actions of the market based on what people “believe” caused the market to move well that I can help you with.
This market continues to be in a strong uptrend establishing itself well above the 50 day moving average. Until the market turns lower on heavier volume making lower highs and lower lows, along with my current holdings showing distribution, then and only then will I entertain a possible topping scenario. Until this occurs, I am just riding the trend higher. That is how you make the real money, and not just scraps, in the stock market.
As Big Wave Trader knows by now Maui is a beautiful place and I doubt you will be hearing from him until he returns to the mainland. Can you blame him? I hope everyone had a wonderful holiday season and while it may not be an easy transition back into work mode, I will be here doing as much as I can to make sure you continue to profit from this rally. Aloha everyone.
Tuesday, December 14, 2010
Stocks Escape Distribution, but Leaders Weaken a Bit
The market gets a late day save as the NASDAQ escapes back to back distribution days as the Federal Reserve rate announcement induces volatility. In the early going the market did stumble, but buyers stepped up and supported stocks prior to the Federal Reserve rate announcement. Stocks spent the majority of time heading sideways prior to the rate announcement. Then came the volatility, the Federal Reserved announced its decisions and stocks went into a volatile mode. By 3:30pm EST it appeared stocks were headed for a deep dive. However, buyers stepped up and saved the market, especially the NASDAQ from back to back days of distribution. Despite the market avoiding distribution today was another day of stalling and a bit of underlying weakness casting doubt on the current uptrend.
Precious metals started the day off well, but ended in negative territory. A big key was the reversal in the EURUSD reversal and pop in the US Dollar. Perhaps this was a one day wonder, but it does appear there is underlying weakness in some leaders casting shadows over the overall market uptrend. By no means does this indicate the “end” to the uptrend, but we need to be prepared for what the market has in store for us. Be prepared and stay focused.
Breadth has been waning and it can be seen in the McClellan oscillator a measure of breadth. While this indicator is a piece to the puzzle it doesn’t fill out the entire picture. The underlying weakness in some leaders is concerning and should be taken notice. However, we aren’t jumping the gun. A few of our leaders may be forming right sides of their bases rather than breaking down. However, any further selling here will certainly cast a very dark shadow on the market. Be prepared.
Cut your losses short.
Tuesday, December 07, 2010
Stocks Stage Reversal as Volume Soars
Current market rally stalls on volume
A brokered deal in Washington on tax cuts and the unemployment extension helped boost futures in the morning. Stocks jumped at the open only to face selling pushing stocks to lows by mid day. Volume on the NYSE was lifted by Citigroup after the government unloaded its remaining shares of the company. Citigroup traded 3.26 billion shares accounting for the majority of the change in volume on the NYSE. However, on the NASDAQ volume jumped more than 18%. The market at the end of the day looked poised to push into the highs of the day before the 3 o’clock hour. Rumors on the street of more insider trading probes helped sellers dump stock on the market. By the end of the day stocks finished on the lows putting in a terrible stall day.
Today is not the end all be all, but more importantly you must be aware of your stocks and how they are acting. One must take profits and cut losses. However, you have to go stock by stock and sell appropriately. If your stock is giving you profit signals ignoring them will only have you wishing you would have sold earlier. With today’s action there are a few stocks that appear to be flashing sell signals and we’ll adhere to them.
Sentiment remains high, last week we saw the AAII Bulls jump to 49.66 and has yet to see sub-40% for quite some time. Coupling the reversal today with sentiment a shake out or a deeper correction may be our midst. If today was not a signal of what is to come we’ll certainly see the market reverse course and continue higher. However, if our market leaders which took a hit today; decide to fall apart we’ll certainly see this market push lower.
Before today, the market and leaders were looking decent. Today’s action certainly put a dent into our leaders and we would like to see the damage limited to today. Regardless of what happens always play great defense and that is to cut your losses short. We may experience further selling, but the importance should be placed on your portfolio of stocks.
Monday, December 06, 2010
Gold and Silver Shine as Small Cap Stocks Lead Stocks
Bernanke’s interview on 60 minutes spark fear over his handling monetary policy
Gold and silver soar after Bernanke’s 60 minutes interview on Sunday night. Stocks consolidated nicely with the Russell 2000 index leading the way finishing higher by 4.44 (+.59) points. Volume was lower across the board, but Monday’s have become light volume affairs. Without economic news stocks moved lower during the morning and gained traction just after noon time. Only late day selling put a negative spin on the day, but with market leaders pushing higher the close was only a blip on the day. The markets consolidated nicely with market leaders pushing higher and our accounts higher.
Bernanke continues to push his loose monetary policy forced investors to gold and silver. The moves in the precious metals are an indication the market does not trust Ben Bernanke handling monetary policy. Gold and silver have been a measure of “money” for thousands of years, it has real history. The dollar is in effect a paper currency and is being devalued by the Fed’s loose monetary policy. It really boils down to the Government running surpluses and the Fed tightening monetary policy before gold and sliver stop their run.
Small cap stocks are taking the lead and this observation is a positive sign for the market. When small caps lead it signals risk adversion is taking a back seat and traders are willing to pay up for stock. When large cap stocks lead, the Dow and S&P 500 is a sign the market is getting tired. We saw this in October and November of 2007. In addition, with the NASDAQ showing positive signs and the Russell 2000 leading this market is poised to continue its run.
Not much in the way of economic news out this week and the headlines will certainly be pointed to the Jobless claim figures on Thrusday. In addition, the EURUSD will continue to be a cross currency rate to watch as the market has traded in concert with the rate. At some point the market will break the correlation, but for now they appear to be trading in tandem.
IBD went back into rally mode last week. They used the Dow Jones Industrial Average to turn the market in correction mode. As it turns out, this was not a wise move. We pay attention to our leaders and the NASDAQ, the Russell 2000 is not too far behind. Stick with the leaders and the laggards should be left behind.
Always cut your losses short.
Thursday, December 02, 2010
Stocks Advance as the Euro Rebounds
Stocks approach 2010 highs as European Debt fears subside
A bigger drop in jobless claims then expected, did not stop the market from pushing higher closing just off the highs of the session. What did help the market was a jump in pending home sales figures suggesting buyers were out procuring new homes. Preliminary volume figures showed volume dropped on the day, but the underlying action was still poisitive. Financial and retail stocks were the big winners of the day as the European debt crisis fears subsided giving a boost to banks. Along side the rise in the market was the Euro stabilizing after its most recent run in with sellers. Leaders acted well today and the market had a decent follow-through from yesterday’s action.
It would have been better to see volume jump on the day as if institutions were rushing in to gobble up shares of stocks. Unfortunately, we may be seeing a similar story as we did last year with the market pushing higher without volume. The strong price action is enough to override the lack of volume we are seeing in the overall market. Again, pay attention to your stocks.
Bullishness once again jumped as the survey out of AAII showed bulls heading to 49.66% and bears at a lonely 26.21%. Bulls are off of their highs just from a few weeks ago, but the recent Euro news and market reaction failed to scare bulls from their positions. Perhaps this is the reason why we saw the market hold up on its 50dma. For whatever the reason the fact remains the market still is in position to push back into new high territority before any substantial move lower.
Tomorrow’s headlines will certainly highlight the jobs report set to be released at 830am EST. The market so far appears to be pricing in a decent report showing gain of 145k jobs. This week the market saw a better than expected rise in private payrolls from ADP and an upside surprise tomorrow should help the market. However, we aren’t in the guess/gambling game. We’ll take our clues from our stocks and act accordingly. Panic buying and selling only nets you red in your portfolio. Stick with your market leaders and use their action to navigate the market waters. Remember, “thinking” in this game is a dangerous thing.
Cut your losses and enjoy the weekend ahead.
Wednesday, December 01, 2010
Stocks Jump on Global Economic News
“Simplicity is the key to brilliance” – Bruce Lee
Stocks turn in a big rebound as economic data in the US and China along with a positive Portugal bond offering help ease the fears of a European debt crisis. ADP Employment change was better than expected as its payroll survey showed an increase of 93,000 private payroll jobs. ISM manufacturing index edged down from October, but was slightly better than expected at a reading of 56.6. Mid-day a rumor of the US backing the IMF bailout fund for Europe pushed stocks to their highs only to have the rumor to be false. Stocks closed just off the highs of the day, but in line with the highs before the rumor mill picked up. Regardless, today was a positive day for the market as stocks jump pushing the NASDAQ above its April high.
Volume was lower, but there was a volume surge at the end of yesterday’s session skewing volume. Many funds have November year-ends and we cannot rule out some funds adjusting their portfolios heading into their year-ends. However, for much of the day the pace of volume outpaced Tuesday’s session which is a positive sign for the market. Like September 1st the first day of the month has been helpful to stocks and today was no exception.
Market leaders enjoyed today session despite some negative action a few yesterday. However, we stress we must pay attention to our own stocks and make decisions based upon their action. Your holdings are your most important decision making tool you have to gauge the market. Are your stocks going through “normal” corrections? IGTE is one of example of an abnormal correction where the stock took a dive to its 50dma on big volume. The stock was a leader until yesterday and its weakness carried forward into today’s action. If all our holdings acted like IGTE we’d be out of the market, but fortunately it was the only one despite the broad market sell-off. Stick to your stocks.
There are a few certain things in the market and that is you will never be able to OUTRESEARCH the big instiutions in the market. They have vasts amount of resources at their disposal to conduct research, it is best to follow their movement rather than to outdual them. Many traders feel they can outsmart the big boys as well as the market in general. Unfortunately, you will never outsmart the market despite all your efforts Accept the reality of the situation and it will only be then you’ll be able to become a successful trader.
A positive day for the stock market and as the greats like to say: the trend is your friend.
Monday, November 29, 2010
* Setting Euro Fears Aside The Market Rallies off the Lows of the Session
Stocks rebound as buyers step up and support the market
The market returned from a holiday shortened week greated by hefty selling as fears over deapening of the European debt crisis. Stocks hung around the lows after a steep sell off heading into the 10am hour. Even a positive Dallas Federal Reserve Manufacturing activity report could not hold off sellers from pushing the markets to their lows. Many leaders were holding up during the sell-off, a positive sign for the markets in general. Just before 2:30pm EST the markets found solid footing and pushed higher back to the day’s high and closing just off the highs of the day. Another positive move by the market bouncing off support and as market leaders continue to act positive the uptrend remains intact.
Market pundits have been pounding the table the market had reached a top. CNBC has been running articles on the market topping and we have seen the highs of the year. While this may be true, as no one person knows the future what we have in front of us says we will push higher. Market leaders remain positive and in control. Not too mention smalal caps are indicating strength and when small caps lead it signals traders are willing to take on risk rather than unload it. The moral of the story is to pay attention to the market leaders and their price/volume action.
In the early going the VIX jumped considerably as fears over a market collapse continued to put pressure on stock prices. By the end of the trading session the VIX index reversed its gains and closed lower indicating further decline in the index is instore. The VIX certainly indicated near capitulation type selling just without the volume. Panic selling over the European crisis is noteworthy, but the action at the end of the day is the most important indication of where the market wants to go.
This week is going to be a big week as far as economic reports. Tomorrow kicks off the week with the following reports: S&P Case Shiller, Chicago PMI, NAPM-Milwaukee report. The Fed’s beige book is out later in the week and CNBC’s favorite the Non-Farm Payroll report on Friday. There should be plenty of noise generated this week, but we’ll be focused on the market action and a laser focus on our leaders.
Tomorrow closes out the month and there will be talk about window-dressing in terms of the market action. We are looking for the market to build upon today’s move off the lows and push higher.
Sunday, November 28, 2010
Top Current Holdings, Total Return, And Date Of Purchase
I am currently fully invested in all of my regular accounts and my IRA. Don't forget to check out the 2010 Big Wave Trading Performance.
ticker symbol – total % return since first purchase – date of purchase
URRE 137% 10/26
MIPS 119% 8/20
RES 89% 7/13
JOBS 81% 8/16
SPRD 59% 8/27
GGAL 54% 10/19
TZOO 47% 9/28
CPWM 44% 11/15
XXIA 40% 8/31
FFIV 37% 10/22
IGTE 34% 9/17
AXTI 34% 9/20
ARUN 30% 8/27
TRS 30% 10/1
IVN 27% 9/14
CGNX 27% 9/24
FVE 27% 9/10
NSU 25% 8/20
MHR 24% 10/12
EPHC 24% 10/15
ACOM 24% 10/4
NNBR 21% 9/1
BIDU 21% 9/20
CWEI 21% 11/2
Friday, November 26, 2010
Performance of Big Wave Trading Ideas
Great performance, but an important lesson to be learned
Cutting your losses makes a big difference in performance and the following charts prove by riding winners and cutting losses you can outperform the market.
How profitable are trade ideas from Big Wave Trading?

Our batting average

Check out our Membership levels here and sign up here.
If you have any questions please email us at sales@bigwavetrading.com
Have a HAPPY THANKSGIVING!
A BIG THANKS TO BJESSE (BWT MEMBER) FOR PUTTING THIS TOGETHER!
UPDATE TO THE POST ABOVE BY BJESSE:
A couple days ago I posted Josh’s YTD trade performance for all but 68 of his 2010 trades. Today I filled in the holes, which consisted of trades closing early in the year. Here are the results for all 614 of his trades YTD. Again, any errors are mine.


Note this confirms Josh’s long term average of 60/40.
I have also included a plot of the Gain/Loss percentage for each trade. If anyone ever doubted the wisdom of “keep your losses small” this should convert you. Going through the trades I was struck again by just how disciplined Josh is at following his sell rules, and how that preserves profits far more often than it results in missed gains.
I have always found it difficult to let my winners run. JH is a master, as this shows; his average gain is 33% with a standard deviation of 44%.
I find these results nothing short of remarkable. Awesome even. It is not a trivial matter to translate Josh’s trades into profit dollars in your own portfolio. But as I said before, there is gold to be mined here.
Thanks Josh and BWT! The CEO should give you a huge bonus :)
Tuesday, November 23, 2010
North Korea and PIIGS Weigh on Stocks as Volume Rises
Fears rise over PIIGS bailouts and potential war in the Korean Peninsula scare traders away from stocks
The markets were rocked with news out of the Korean peninsula where North Korea and South Korea fired upon each other. Futures weakened considerably throughout the early morning session as European fears continued to put pressure on stocks. A better than expected GDP results and a spike in the Richmond Fed Index couldn’t help push stocks higher. Volume on the NYSE rose much higher than Monday’s level where the NASDAQ only saw its volume barely above Monday’s level. Market leaders were largely positive, but overall the damage was done with the banks. Today’s action was not ideal, yet we were able to find support at the lows with a few leaders finishing in the green.
Panic certainly struck the market today as fears regarding Ireland’s bailout, but now attention is turning to other countries making up PIIGS. Spain is the real issue here whereby its bailout will certainly be the grand daddy of them all. It is surprising the European Union hasn’t set up a TARP like program to deal with its banking issue, but what really needs to occur is for governments to run surpluses with slashing entitlement programs. Many will cry foul and ask for bigger taxes, but increasing taxes does not solve the problem of insolvency. It is an easy equation and for it to balance out spending needs to be drastically cut. But, all of this, for our markets with leaders showing promise we may have seen one giant shakeout.
It is entirely possible to see the market roll over here and we’ll be very quick to cut our losses and push to the short side of the market. However, with the market showing support at the lows today along with plenty of leaders finishing in the green today it shows a positive direction for the market. Let’s not use “we are oversold” as an excuse for the market to go higher. We can certainly stay oversold for quite some time, but with the recent selling we should see a drastic reduction in AAII and II Bulls. Stick with the leaders and your stocks.
Tomorrow morning we are going to get a flurry of economic data the market will get a chance to digest. More importantly will be how the market reacts to this as well as any news coming out of Europe and the Korean Peninsula. Any further downside should throw caution to the wind and should get you on the defensive. Always be prepared and have a plan and as always cut your losses.
Friday, November 19, 2010
Reversing Course Stocks End the Day off the Highs but with Big Gains
Better than expected jobless claim figures and a big jump in Philadelphia Fed index pushed stocks higher. Volume rose across the board as traders rushed to get back into stocks. Late day selling did knock stocks off their highs of the day, but gains were plentiful and solid. Today’s action does go a long way in to bring back the current uptrend. Given the gains and volume it is highly probable the rally will continue.
The index I focus on is the NASDAQ and second would be the S&P 500. Outside of these indexes there really isn’t any other index I want to pay attention to. The Dow Jones Industrial average is an ancient index and using this index to put the market in correction is not something I would put much stock into. Recently, the Dow had 6 distribution days yet the NASDAQ had only suffered 3 days worth while the S&P 500 had 4. The leading indexes, NASDAQ and S&P 500 didn’t have the heavy distribution you normally see at a market top. If we do see distribution over the next few days it would signal major weakness, but for now the uptrend still lives.
Many are comparing our recent market with the April highs. Why not, it is recent history and we all tend to think history repeats itself. The major difference is the February through April run came off a 3 week 8% decline in the market. Our recent uptrend came off the back of a longer and deeper correction. Thus, the probability of a 5% pullback and the uptrend remaining intact is high. Perhaps we do roll back over, but until we get full sell signals in our stocks and the NASDAQ/S&P 500 pile on the distribution this uptrend will continue.
Well, my McClellan is still in oversold territory, but that will hardly mean anything if distribution creeps back into the market. One index did see a 17 point drop was the AAII Bull index while the index dropped to 40% while the bears jumped to 33%. Sentiment took a big hit and it isn’t out of the ordinary for a market to shakeout nervous bulls. Especially if sentiment gets out of hand like we saw over the past few weeks. The drop in Bulls does not guarantee we will rip higher over the next few days, but it is a good sign the shakeout over the last few trading days has cut down sentiment.
Tomorrow is an option expiry Friday where volume will be exaggerated in the early going. It’ll be important to see who the market reacts throughout the entire day as well as leading stocks. The most important thing would be to cut your losses short.
Wednesday, November 17, 2010
Late Day Volatility Brings Excitement as the Market Awaits GM’s IPO
Market leaders did little to inspire, but we held Tuesday’s low
The market did very little to calm the nerves of anxious bulls as the Dow closed slightly lower while the S&P 500 closed just higher. Volume ran lower across the board as the market was able to hold off from moving past Tuesday’s low. Closing slightly higher the NASDAQ fared better, but the index ran into a brick wall in the last hour as sellers slammed the index. A wild ride in the last hour made the day interesting and kept traders on their toes. We did see the market close off their lows, but overall the market lacked an impressive rebound after Tuesday’s heavy volume selling.
We may be oversold, but like the market was overbought we can see this market stay oversold for quite awhile. One thing is for sure, we have cleared the overbought conditions from the September 1st market uptrend. It all boils down to your stocks and what they are telling you. Are they giving you complete sell signals? Profit taking signals? Ignore the noise and hoopla from the financial media and focus on your stocks.
Much will be made of the GM IPO as it starts trading tomorrow. At this time we do not have a specific view on GM simply due to the lack of trading history. No one really knows how the stock will act, but it does appear most feel the stock will quickly sell off as the stock begins trading. Speculation is swirling around the company, but at least in its latest quarter it did not lose money on every car it sold. Wait for the stock to trade for a few days and set up a possible IPO base before jumping in. Despite your feelings on the bailout or how the car company has been handled it may present an opportunity to make some money.
If we are to move higher will need to see a better showing out of our market leaders. Today a few leaders did make a move higher, but there wasn’t a contingent of leaders pushing the market higher. It’ll be important for the market to have the leading stocks push higher like we saw on September 1st. Remember to cut your losses short!
Tuesday, November 16, 2010
Stocks Tumble in Heavy Trade As Fears over Economic Conditions Grow
European Debt Crisis 2.0 and Chinese Inflation strike fear in the market.
“If a tree falls in the woods and no one is around, does it make a sound?”
There were plenty of traders around to see the market make take a dive to close lower (NASDAQ) for the fourth straight day. Volume jumped across the board as traders feared the worse in the European Debt crisis 2.0 and Chinese worries over inflation. Late day selling tried to collapse the market, but buyers were able to push stocks off the lows of the session. Despite the last ditch effort the market still closed near session lows.
Investors Business Daily put the market into correction mode after signaling the market in correction. IBD has had a streak of bad luck when putting the market into correction mode. After putting the market in correction we saw the July rally and again in September. While leading stocks have been beat up pretty good after a few days worth of selling they still are holding their moving averages. Remember, taking profits, working a position is a wise strategy and if you failed to take profits on the way up you will not forget in the next rally.
The McClellan Oscillator has moved further into extreme oversold conditions. Remember, these conditions may last longer than you might think. However, the oscillator is about at the same levels we saw at the February, July, and August/September lows just before the market rallied. At the very least, we should see some sort of bounce from the market. Will it turn into a new run, that remains to be seen and quite frankly we’ll need to see some serious strength from leadership. Anything is possible, but panicking and selling out because you panic will only net you heart ache.
It appears many pundits are rushing to be the first to call a top in the market and get on the short side. This includes IBD, who I respect greatly and appreciate the information they provide and that I pay for! At any rate, we did suffer quite a bit of damage, but we have yet to see “the great unwind.” The market is the ultimate pricing mechanism, but speculating on what may happen is gambling. Take cues from your tocks and if they are flashing classic sell signals.
Stay prudent in this market and avoid panicking!
Monday, November 15, 2010
Volume Slides, but Late Day Sellers Push the Market to the Day’s Low
Merger Monday fails to spark buyers
Late day weakness left a sour taste in traders’ mouths as late day sellers closed out the market near session lows. Mixed economic data got the day started with a better than expected Advance Retail Sales figures surprised the market. However, a very disappointing Empire Manufacturing report did not help ease traders’ minds about the economic recovery. Volume ran light throughout the day with the exception of the early morning gap where the NASDAQ experienced volume running higher than Friday levels. At the end of the day we were able to hold Friday’s lows, but the late day selling suggests we have further to go on the downside.
Friday’s sell off did some damage, but left the S&P 500 with 3 days of distribution and the NASDAQ with only 2. Given the bullishness from AAII investors last week it is no surprise this pull back has gone as far as it has. The market is, at the moment digesting more than 10 week’s worth of gains and to expect the market to continue to rise is foolish. Remember, markets do not move in straight lines and history shows us little intermediate corrections will occur in market rallies. While we certainly could be seeing a top form we have yet to see the signs of a “top.” Right now, we are simply in an intermediate correction.
One indicator I have neglected is the McClellan Oscillator. Price and volume reign supreme, but the McClellan oscillator has been a decent indicator regarding oversold and overbought conditions. Keep in mind the oscillators including the McClellan shouldn’t be used in absolute terms but as a guide. Right now the Oscillator, depending on how you calculate it is in oversold territory. Oversold conditions can last much longer than you expect and May/June certainly proved this, but the current pull back certainly seems to be nearing an end. Whether or not a bounce will produce much remains to be seen, but for now we must be prudent investors.
We did see a few big cap technology stocks take a bit of a hit as sellers really took to these stocks as they have been leading the market higher. Even with heavy volume selling these stocks have held key long term moving averages. Intermediate pullbacks like we are seeing right now highlight the importance of buying right and not chasing including these big cap technology stocks. If you had chased these stocks you would be sitting on hefty losses and being forced to cut loose your positions. Staying disciplined is the best course of action.
Be defensive right now; keep any new positions on the lighter side until this market can prove its worth by pushing higher on volume. As always cut your losses!
Thursday, November 04, 2010
Stocks Rebound on Federal Reserve Announcement
The market responds positively to the Federal Reserves $600bn asset purchase plan
Big two market events down, one to go for this week. The Republicans stormed the elections with big wins in the House of Representatives, but failed to make a big push in the Senate. Even with a big Republican victory the market quickly turned its attention to the Federal Reserve’s Rate Decision. More importantly the market was looking for language specific to a fresh round of asset purchases from the Federal Reserve. Ben Bernanke and company announced a $600 billion ($600,000,000) round of buying of the long end of the curve. In true post Federal Reserve announcement action the market swung wildly as it tried to digest the news. By the end of the day the market closed just off the highs of the day with volume jumping above yesterday’s level and our uptrend remains intact.
For most of the session stocks spent a good amount of time in the red as traders feared asset purchases may NOT be as big as previously thought. Fear can lead you to mishandle your stocks and cause you to sell out too early. We have a strong trend with plenty of stocks moving higher. It is best to stick with them rather than to cut out of them too early. Today is a prime example you must stick with your winners until they begin to show signs of major weakness especially in a strong uptrend. Taking a portion of your position off to lock in gains is wise, but removing an entire position will cause you to sit out major moves in some big stocks.
A major hurdle today was cleared with the April highs with big volume. The market along with our leaders will continue higher with such a strong move today. If we do turn with leaders breaking down we’ll adjust accordingly, but all signs right now are pointing for this market to continue higher. Regardless of what you think about the Federal Reserve printing money or if we were pricing the market in gold the bottom line higher prices are to come.
The market will set its sight on the Unemployment release on Friday. Perhaps a worse than expected jobs report will bring on talk of Quantitative Easing part three, but at this point any is pure speculation. So far, this week we have seen the market move in a positive manor despite what we may have seen as headwinds. Friday’s number in the long run may not even matter with strong corporate earnings with the Federal Reserve and elections behind us. The key takeaway is our stocks are acting well, the market is acting well, and our stock leaders are continuing to show strength. Until this changes, all systems are go for higher ground.
Remember, always cut your losses short and ride your winners!
Wednesday, November 03, 2010
The Market Advances on Mixed Volume
Traders anticipate positive news from the mid-term elections and the Federal Reserve Rate Decision
Election Day is here and the market cheered its arrival. Volume on the NASDAQ slid higher while he NYSE volume skidded slightly compared to yesterday’s levels. Mid-term elections and the Federal Reserve were the talk of the market as many debated the effects we may see. Clearly the market was giving a vote of confidence today with the NASDAQ extending its gains. The one drawback was the inability for the NASDAQ to take out its April highs, but we did close just below those levels. All in all, a good day for the market and helped erased any doubt yesterday and last week may have brought.
Today was a great example of why opinions DO NOT MATTER in the stock market. Yesterday’s commentary was cautionary, but I highlighted the fact we need to focus on our stocks and not our opinions. Too many traders try to time the market perfectly and suffer great losses. Identify a trend and find the leading stocks and get long. Fighting a trend is a futile effort and will only lead to you losing more money. For example, in October Doug Kass was shorting stocks because the “rally has gone on too long.” If you stuck with Mr. Kass’ investment philosophy you have been beaten up as of late.
A big win was the move in small cap stocks as the Russell 2000 closed up 2.05%. Volume figures I won’t have available to later, but the move in small caps showed this uptrend more than likely has a lot more room to run. Small caps had been consolidating and lagging the NASDAQ, but today’s move was a good signal small caps are looking to make another big push.
The Federal Reserve’s key decision tomorrow has the dollar moving lower once again. Commodities have been flying as cotton has made another all time high. Sugar and coffee have seen decent runs as of late and with the Federal Reserve continuing to print more money commodities and stocks will continue to reap the benefits of money slushing around. Crude oil continues to push higher as it too as it benefits from the excess money. Clearly the dollar is in a downtrend as it continues to price in the Federal Reserve’s monetary accomodation.
Regardless of what is going in terms of news flow it is all about the stocks. So far we continue to see our stocks acting well and not giving us major sell signals. Of course, as a stock moves higher we want to take profits and to lock in gains. Stick with your winners and cut loose your losers!
Tuesday, October 26, 2010
Buyers Erase Early Losses as Volume Ends Mixed
Market Leaders continue strength
Early selling pressure quickly dissipated as buyers stepped up to push stocks well off their lows of the session to close positive. Better than expected Consumer Confidence and Richmond Fed Manufacturing Index figures fueled buyers just after the 10am hour. Volume ran mixed all day long with the NASDAQ volume running higher while the NYSE fell behind Monday’s pace. All the major indexes were able to close in positive territory, but the close lacked the buying surge we would have loved to see. Regardless, the move off the lows and with a few market leaders pushing higher the day was a positive one.
The NASDAQ gapped down taking out the 2480 level, but it wasn’t gone for too long. Case-Shiller pricing data was not perceived as a positive for the market stoking a bit of fear in the hearts of traders. Once 10am hit the NASDAQ was able to recover and leap frog the 2480, but found a new resistance level. 2500 level on the NASDAQ is playing resistance for now and we’ll need to see the index to push above with volume very soon to avoid the risk of rolling back over.
Market leaders are always important and most important to gauge the health of the market. At the moment our leaders continue to look strong and continue to build on gains. Our cloud computing leaders have even reversed course from their October surprise to turn positive. High fiving FFIV sprinted nearly 7% in after-hours trading after leaping almost 2% in the day’s session. FFIV was a stock that flashed a buy signal on Friday along with another cloud computing play. It is truly a positive signal for these types of move for the market.
A big mistake traders are going to make will be one of two things. Either they will sell TOO early or sell TOO late; it is ok to take profits off the table as a stock moves higher. It isn’t ok to sell off an entire position in a strong uptrend when you own a strong fundamental stock. If you do sell too soon do not hesitate to jump back on a leading stock. Often times traders make the mistake of not getting back on a stock they sold only to watch the stock blast higher. Be sure to take profits, but be wise and judicious on how you sell.
The market is set to continue its uptrend and without major distribution days and major market leaders crumbling it is hard to think we roll over here. In October when our cloud computing plays turned sour, they were able to find support at their 50dma. A good sign and now have reversed their course. If this market were to roll over we’d see more than just one group fall flat.
One group to continue to keep an eye on is the financial stocks. They continue to feel a tremendous amount of pain and for good reason. After a decade of poor management and excess leverage the filth remaining on their balance sheet will haunt them for quite some time. With that said, even small moves to the upside will help out this market and any sustained move will only support this market further.
Always keep your losses short and ride your winners!
Monday, October 25, 2010
Late Day Selling Throws a Dent in Day’s Gains
Good housing data fails to spark buyers, but stocks end in the green.
An unfortunate reversal at the end of the day leaves a sour taste in the mouths of traders. A better than expected existing home sales figures did give a temporary boost to prices, but it quickly faded as the market began its mid-day weakness. Volume ran higher on the NYSE all day long, but it wasn’t until the afternoon until the NASDAQ’s volume began to outpace Friday’s levels. The last thirty minutes of the trading session saw sellers dominate trading. Many leading stocks held up nicely, but a few did follow the general market. We did not see any major reversals from leading stocks as many remain very healthy. Not a great day, but our uptrend remains.
Over the weekend the G20 meetings did have a few notable headlines. In the grand scheme of things we only care about leading stocks and the price and volume action of the market leaders. If we were to pay attention to the noise coming from news outlets would only cloud our judgment and ruin our returns. It is very difficult to guess how the market will react to a certain situation, but if we focus solely on the market action and leaders we can avoid costly mistakes. We see too often traders try and “trade” news headlines and guess a new trend. It simply isn’t a wise move in this game.
We did see the 2480 level taken out, a level I had spoken about last week. Friday we saw sellers keep the NASDAQ from breaking this level even with a few leaders breakout out or getting support at major moving averages. Now the market is receiving headwinds at the 2500 level and this market will need to be able to break above and hold. And of course we’ll be watching April highs as the market approaches those levels.
Right now the NASDAQ has two days worth of distribution with a quasi stall day. Today can be classified as a stall day because volume was higher than Friday, but it was below the 50dma. The caveat is volume coming below average, but be aware if this market does flash another stall day or heavy distribution.
Tomorrow we’ll get another round of housing data from Case-Shiller and a reading from the Richmond Fed regarding manufacturing. However, more importantly tomorrow will be one week until the mid-term elections and continued talk about what it means to the market will continue. Do not pay attention to the noise, focus on the action of market leaders and the overall market!
Always cut your losses short!
Wednesday, October 20, 2010
Stocks Rebound from Tuesday’s Losses
Late day selling ends stocks off the highs as volume slows
Late day selling put a cap on the day’s excitement as stocks rebound from Tuesday’s heavy distribution day. All eyes would point to the Federal Reserve’s release of its beige book at 2pm EST. Prior to the release the market was able to build upon its gains as it moved higher. Volume simply couldn’t keep up with Tuesday’s pace ending lower across the board. The end of the day selling certainly did not inspire confidence, but a few after-hours earnings reports helped soothe any pain. A nice recovery, but we’ll need to see the market flash more accumulation.
NFLX earnings and its subsequent push in after-hours trading gave a cheer to traders. The stock continues to be a favorite of shorts due to its “valuation.” The biggest winners of all time tend to have a high valuations are due to the demand for the stock. Regardless, NFLX stock is a true winner and continues to be a top stock. NFLX is looking to follow in GOOG’s footsteps post earnings release and avoid an AAPL like day.
Another darling in after-hours trade was EBAY as the stock shot up more than 7%. After-hours trading can be misleading, but with EBAY posting strong numbers the stock will look to move along with NFLX. Although its quarterly report didn’t come close to matching NFLX’s growth the report was strong considering the size of EBAY. The NASDAQ will get a boost from EBAY and NFLX
The market remains in an uptrend even with Tuesday’s distribution day. Despite who CNBC parades through their studios or who Bloomberg throws on the radio we have a viable uptrend. History suggests bull markets do not last longer than 18 to 24 months, but for now this rally from March 2009 can still go higher.
From a historical perspective, one our members have heard is we are likely heading for major headwinds over the next 6-12 months. Despite what Ken Fisher or other bulls may squawk about mid-term elections it is highly likely we see a correction of more than 20%. We could even delve into a 1940 to 1942 type market where we simply roll over and take out our March 2009 low much like the 1942 took out the 1938 low. Anything is possible, but for now we are focusing on the long side until we begin to see more “topping” signals from the market.
This market will more than likely push higher, but remember to always cut your losses!
Saturday, October 16, 2010
Top Current Holdings With Total Returns And Date Of Purchase
Long 56 stocks 98-100% invested on full margin. All longs listed were posted on the website before being purchased for subscribers of the silver, gold, and platinum packages under the ‘new longs’ section.
stock symbol – total return – date of purchase
JKS 138% 7/13
LCUT 126% 11/2/09
LGL 101% 9/8
RES 60% 7/13
JOBS 56% 8/16
MIPS 51% 8/20
ISLN 36% 8/31
ASYS 34% 9/1
CHTP 29% 9/3
SOL 27% 9/14
IVN 26% 9/14
NSU 24% 8/20
XXIA 22% 8/31
SPRD 22% 8/27
CGNX 18% 9/24
UFPT 18% 9/15
stock symbol – total return – date of purchase
JKS 138% 7/13
LCUT 126% 11/2/09
LGL 101% 9/8
RES 60% 7/13
JOBS 56% 8/16
MIPS 51% 8/20
ISLN 36% 8/31
ASYS 34% 9/1
CHTP 29% 9/3
SOL 27% 9/14
IVN 26% 9/14
NSU 24% 8/20
XXIA 22% 8/31
SPRD 22% 8/27
CGNX 18% 9/24
UFPT 18% 9/15
Friday, October 15, 2010
Bank and Education Stocks Weigh on Stocks
The market side steps a distribution day consolidating recent gains.
New banking fears helped push stocks lower, but a late afternoon buying spree lifted stocks off the lows of the session. Today’s consolidation was not out of the ordinary considering the move in equity prices, but the late day buying did help ease any worry. Education stocks once again were hit hard after APOL had some tough news for the market to digest. Banks and education stocks were the leading cause of the equity decline today even as volume came in lower across the board. The market was able to avoid distribution with volume sliding lower on the day. A great day of consolidation for the market showing this uptrend is quite healthy.
The real story was in after-hours trading with GOOG stock jumping around 9% after the company reported its quarterly results. We can get into the positive news out of the company like a rise in paid per click but the true test will come when the stock trades tomorrow. Will the stock gap and run? Yesterday we saw a few stocks gap and reverse like JPM, IGTE, and ADTN. GOOG on other hand has been a stock beaten up after earnings reports as of late. The strong posting in earnings is a positive sign for technology stocks.
Once again our financial stocks have a new fear to get over. The foreclosure crisis is just another step in our banking system deleveraging a system riddled with fraud and illegal behavior. Removing the excess leverage in the system is uncovering many naughty secrets from the housing boom of the last decade. When the government swooped in and saved the banks it kicked the can down the road rather than dealing with everything up front. We can equate this to taking off a band-aid, when the government stepped in it essential was stopping the band-aid from being ripped off. Now, we are dealing with a slow wrenching pain. Regardless, banks continue to look weak and not a sector we’d entertain, but they do weigh on the overall market.
It is quite impressive given the education stock debacle and foreclosure crisis the market was able to avoid a day of distribution. Normal corrections during an uptrend are to be expected, but we are far from what is normal and to see the market shrug off this type of fear is good news.
This uptrend is very healthy and we continue to find more stocks breaking out of bases it is hard to think this market cannot go higher. Stay focused and enjoy the weekend!
Thursday, October 14, 2010
Zoll Medical Corporation: Strong Growth in a Growing Medical Equipment Market
As per their website Zoll Medical is a leader in medical products and software solutions, helps responders manage, treat, and save lives in emergency rescues and in hospitals; outside the hospital while at work or home; in doctors' and dentists' offices and schools; in public places and on the battlefield. ZOLL's products contribute to managing patient care and savings lives, as well as increasing the efficiency of emergency medical, fire and hospital operations around the globe.
When we look at the recent growth in EPS and sales for Zoll Medical (ZOLL) we can see that their products are clearly in demand. During the past two quarters YOY EPS growth has been 113% (.17 compared to .08) and 271% (.26 compared to .07). Sales growth during the past four quarters YOY have increased 2%, 18%, 15%, and 17%. Even better, 2010 and 2011 EPS estimates are for gains of 89% and 38% respectively.
The company also carries 0% in debt, has a Return on Equity of 3%, an EPS growth rate of 32%, and a cash flow of $1.34. Zoll Medical definitely has strong growth and sound financials.
Stocks do better when they have other stocks in their industry group performing well on a RS basis. Nxstage Medical (NXTM), Dexcom (DXCM), BSD Medical (BSDM), Tearlab (TEAR), Synergetics USA (SURG), CAS Medical (CASM), Hill-Rom Holdings (HRC), and Cephid (CPHD) are just some of the stocks in the Medical-Systems/Equipment industry group that carry RS ratings of 80 or higher. So this is just one more item in favor of Zoll Medical moving higher.
Recently mutual fund ownership has started to increase again from 94 funds in the most recently reported quarter from 90 the quarter before. However, four quarters ago the stock did have 102 funds invested in it. That is OK, since we do have growth in the most recent quarter.
While these numbers are impressive for Zoll Medical, the most important aspect is the chart. Is the stock in an uptrend and under accumulation? Yes. Since that is the case we need to find a good low risk high reward entry. On that end the move on Thursday is definitely what I was looking for.
The stock bounced off recent support on strong volume with the stock breaking above the short-term downtrend line. The stock also closed very near the HOD indicating the buying should spill over to Friday morning. The purchase price for me is the 33.41 close on Thursday.
This is a great stock with strong fundamental growth and a bullish chart under accumulation. With the market being in a current uptrend thus putting the odds of purchasing this stock well in our favor, Zoll Medical will be a new purchase for me on Friday.
If the stock does not move higher immediately, I will be cutting my losses—protecting my hard earned capital—with a close below the LOD of Thursday (32.25).

Disclosure: Long Zoll Medical (ZOLL)
When we look at the recent growth in EPS and sales for Zoll Medical (ZOLL) we can see that their products are clearly in demand. During the past two quarters YOY EPS growth has been 113% (.17 compared to .08) and 271% (.26 compared to .07). Sales growth during the past four quarters YOY have increased 2%, 18%, 15%, and 17%. Even better, 2010 and 2011 EPS estimates are for gains of 89% and 38% respectively.
The company also carries 0% in debt, has a Return on Equity of 3%, an EPS growth rate of 32%, and a cash flow of $1.34. Zoll Medical definitely has strong growth and sound financials.
Stocks do better when they have other stocks in their industry group performing well on a RS basis. Nxstage Medical (NXTM), Dexcom (DXCM), BSD Medical (BSDM), Tearlab (TEAR), Synergetics USA (SURG), CAS Medical (CASM), Hill-Rom Holdings (HRC), and Cephid (CPHD) are just some of the stocks in the Medical-Systems/Equipment industry group that carry RS ratings of 80 or higher. So this is just one more item in favor of Zoll Medical moving higher.
Recently mutual fund ownership has started to increase again from 94 funds in the most recently reported quarter from 90 the quarter before. However, four quarters ago the stock did have 102 funds invested in it. That is OK, since we do have growth in the most recent quarter.
While these numbers are impressive for Zoll Medical, the most important aspect is the chart. Is the stock in an uptrend and under accumulation? Yes. Since that is the case we need to find a good low risk high reward entry. On that end the move on Thursday is definitely what I was looking for.
The stock bounced off recent support on strong volume with the stock breaking above the short-term downtrend line. The stock also closed very near the HOD indicating the buying should spill over to Friday morning. The purchase price for me is the 33.41 close on Thursday.
This is a great stock with strong fundamental growth and a bullish chart under accumulation. With the market being in a current uptrend thus putting the odds of purchasing this stock well in our favor, Zoll Medical will be a new purchase for me on Friday.
If the stock does not move higher immediately, I will be cutting my losses—protecting my hard earned capital—with a close below the LOD of Thursday (32.25).
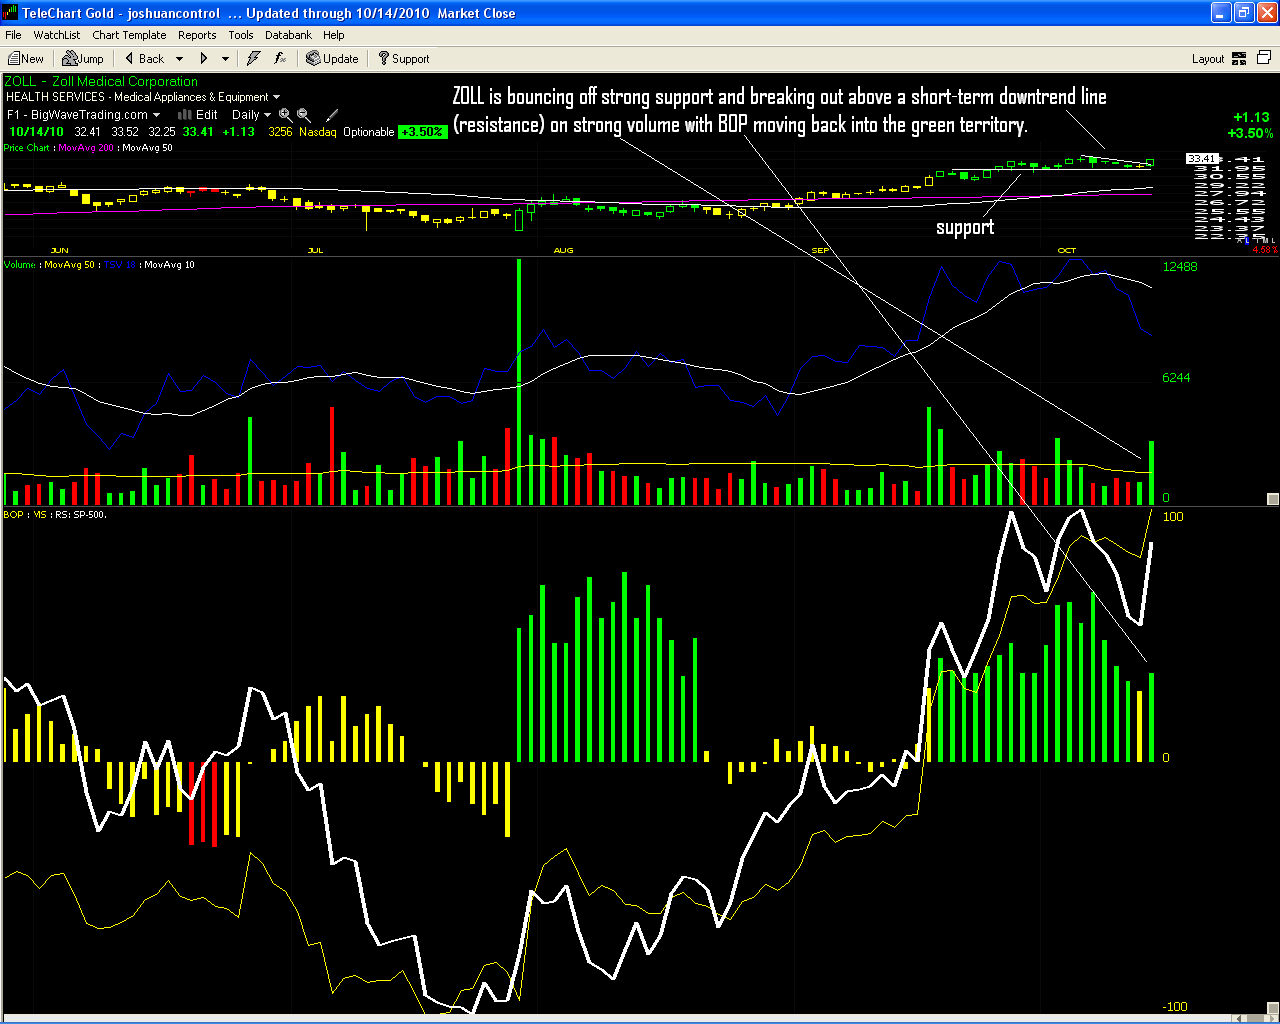
Disclosure: Long Zoll Medical (ZOLL)
Stocks Slide in Last Hour of Trade, but End Higher on Volume
Current uptrend logs another day of accumulation
Late day selling dampened the mood, but an overall positive day in the markets. Volume jumped across the board as the market mostly cheered about positive earnings reports and tepid inflation readings. Import prices were relatively in-line with expectations despite the overwhelming talk about the Federal Reserve second round of monetary easing. The late day selling is not surprising considering the move in the markets, but the action from stocks post earnings reports leaves a sour taste in the mouth. Even with the weak close the market is still in a solid uptrend.
The weak close suggests we may see a pull back tomorrow. The chances are good we see the market take a breathier. Consolidation is a necessary process for the market to undergo as we simply cannot go straight up. These periods can last a few hours in rare cases to a few days. As long as we do not see market leaders collapse and distribution the resting period is quite normal action. Pay attention to your stocks, if they begin to weaken take notice and make sure you are taking profits.
The earnings curse once again hits this quarter with JPM, IGTE, and ADTN reversing after seemingly good earnings reports. JPM stock is far from one we would like to be long, but the action in IGTE and ADTN both leaders are slightly troubling. Both were able to find support at their 50dma, but their charts are now damaged. It will take some time to repair the damage done today, but it isn’t something we would want to stick around to wait for. We’ll need to see the stock tighten up and form another base before we would get long.
Another big deal of the day was AAPL stock hitting the $300 market. The stock was able to hang onto the mark as the company said it would release a new operating system. AAPL stock has been a stalwart of this market rally and has yet to suffer any major setbacks. If this market is to go higher, we’ll need to continue to see strength in the market.
In a surprising move a deal for YHOO stock surfaced after-hours pushing the stock higher by 13%. The move will certainly help the NASDAQ tomorrow, but the question will be if the rest of the market will respond positively to the bid for a beat up technology stock. On the other hand you have ORCL posting a strong day without a takeout rumor. Ideally, you want to own a stock that is strong and not guess whether or not the stock may be taken out.
Be mindful of your losses, always cut them short.
Top Current Holdings With Total Returns That Closed Higher Today: JKS 140% JOBS 65% LGL 64% RES 57% MIPS 47% SOL 41% ISLN 31%, IVN 30%, NSU 24%, CGNX 21%, XXIA 21%, GBG 20%
Thursday, September 16, 2010
Jobless Claims Drop Along With Volume as Stocks End Mixed
ORCL Posts Positive Earnings as the Stock Jumps After Hours
Today was another day of gains in the market with the NASDAQ closing higher for the 10th time in the last 11 sessions. Early going the market was given a dose of good news with Jobless Claim figured showed a claims fell more than expected. However, buyers weren’t excited as the market pulled back in the morning, even with the Dow finding green territory. Volume ran lower throughout the day as sellers didn’t gain much traction. Small caps pulled back and underperformed noticeably, but with volume coming in on the light side it hasn’t become a glaring red flag. While the crowd continues to look for a pull back this market continues marching higher.
AAII sentiment survey showed Bulls jumping above 50% while Bears dropping below 25%. The shift certainly highlights the need for consolidation in the market. While the sentiment survey isn’t a sell signal it can signal turning points. However, with the market off its lows and still well off the April highs the survey shows how jittery the crowd can be. Back in August we did see the survey along with the Investors Intelligence survey show bears at max levels indicating an intermediate low. Remember, sentiment survey’s aren’t meant to be “indicators,” but reference points.
If you read financial websites and other pundits most will let you know about obvious resistance levels and overbought conditions. We are more concerned with our stocks. Normal corrections or pullbacks happen and are a part of any uptrend. Many will sell out of positions well before ultimate tops and lose out on big gains. With so many top quality stocks continuing to act well it is not likely a pullback here would lead to new lows. In fact, a pullback may offer secondary buy points. Let the stocks guide you rather than opinions about the market.
Tomorrow we have options expiry and most certainly push volume higher. Friday’s action will certainly be helped out with ORCL’s earnings. In after-hours trading ORCL jumped 4.6% after posting better than expected earnings. Revenue jumped to $7.59billion when compared to $5.06billion a year ago. The jump was welcomed by the market and should continue into tomorrow’s market.
Keep in mind chasing stocks away from a proper buy point will only increase the odds you being shaken out of the position. A huge benefit you get from Big Wave Trading is we do not chase stocks and buy properly keeping the emotion out of trading. Always cut your losses short as huge losses are very difficult to recover from.
This economy has been tough for many Americans. While government figures point to unemployment just under 10% other statistics show unemployment in the double digit range. Unfortunately, this has forced many Americans to tighten their belts, but there is something you can do! Take charge of your financial future with Big Wave Trading. Email us at sales@bigwavetrading.com
Top Current Holdings With Total Returns Since Purchase Up Today: JKS 128%, LCUT 137%, RDCM 59%, ISLN 21%, MMYT 20%, QLIK 15%
Monday, February 15, 2010
Saturday, August 22, 2009
Factory Index Gives a Boost to Stocks
Just no quit in this market, stocks rose for the third straight day as positive news from the Philadelphia Fed Factor Index rose unexpectedly. In other economic news jobless claims rose as well giving some concern a recovery jobs has yet to materlize. The 3+ million jobs President Obama promised with the stimulus has netted a loss of over 2 million jobs. Historically speaking jobs is a lagging indicator and we continue to see jobs being lost. Volume was mixed in the morning with a buying surge on the NASDAQ while the NYSE was quiet. As the day wore on the tide shifted towards the NYSE as volume picked up while the NASDAQ volume drifted lower. Although volume was lower on the NASDAQ it was still a bit higher than Monday and Tuesday's volume showing buyers continued to step in. A very nice day for stocks as leaders kept pace as well as new leadership groups emerging.
We are heading into options expiry Friday while existing home sale data will be released. More often than not, odds are, volume will more than likely be skewed to the upside. Friday happens to be Day 5 of this rally attempt from Monday's global sell off and options expiry might skew the volume enough to where we could find ourselves following through confirming the rally attempt. The ideal situation would for the market to simply inch back to Monday's lows (a few weeks to do so) and begin another rally attempt. This would allow our leaders to set up in proper bases and not shoot up from 1-3 week bases. At any rate, we can dream of ideal conditions, but focusing on what is and going with the trend is the proper course of action. If we follow through tomorrow so be it and we'll take it from there.
Hard to imagine what a week does to stocks, but looking at a weekly chart we are back where we started last Friday. After Monday's hiccup stocks have been pushed higher; the NASDAQ flashing signs of accumulation. This market is ready to dish out blows that can come from any where and we better be ready for it.
Looking at secondary indicators in the market we can see New Highs aren't quite up to other bull market standards. This doesn't have me worried too much because there has only been 3 other occasions in the history of the stock market where stocks fell more than 60% across the board. Putting this rally into context with other great bear markets it is quite conceivable we'd see a lagging New Highs compared to more recent bull markets. Even the put/call ratio really isn't show extremes on either side which leads me to believe the market is finding equilibrium between sentiment. There is one story out there and that is the VIX's failure to keep above its 50dma. This may be an overlooked area but in 2003 the VIX had a terrible time with its 50dma as well. It continued its slide into the teens from well above 30. These areas are secondary to price and volume action and should be treated as such. No one indicator will ever take over price and volume.
Enjoy your Friday and make sure you cut your losses short.
top longs up TODAY w/ total returns since 1st buy: DAN 224% KONG 133% CAR 101% FIREE 115% ATSG 125% CAMP 86% TEN 82% CHBT 21% BZ 39%(79% EARLY) NAVI 23% LAD 47% VOCL 26% CISG 23% FUQI 36% RINO 20% GRRF 20% OMN 43% OPWV 26% IILG 25% OGXI 21% ACTG 56%
Wednesday, August 05, 2009
Late Day Support Kicks the NASDAQ into Positive Territory as Small Caps Take Charge
Small caps continue their reign over larger cap stocks as small cap indicies notch very nice gains. Going against the common thought of a pull back stocks continued their march higher despite the majority calling for a pullback. Just about 2pm EDT stocks took a dive, as the NASDAQ headed back to the 2000 level. Buyers stepped up to the plate showing their support and as the late day surged grew so did volume. More importantly, leadership is strong and is showing the strength needed for this market to continue moving forward. In the face of the market needing a pull back it thrusted forward with leaders out in front.
Regardless of whether or not this market needs a pullback I immediately point to the leadership of this market. They will be the ones telling you the health of this market. At the moment, we are seeing big stock leadership taking over this market suggesting institutional cash is beginninig to flow steadily back into the market. Off the March lows we simply saw a junk-off-the-bottom rally where many shorts were being forced out of their positions due to extreme price action in many stocks. Whether or not the selling was "overdone" it sparked a fierce short-covering rally that is on its last legs. This is why it is extremely important for big stock leadership to emerge because without their leadership this market would wilt and roll over.
At this point, if we begin to roll over or go higher I welcome any move the market decides to make here. The market and leading stocks will guide me through the waters of this market. At the moment, it simply appears the fat is being trimmed off and the true leadership is beginning to emerge from the bottom. It won't be long before many of these leaders will show tremendous strides and possibly turn into Monster Stocks. While this may not be a perfect bull market it is certainly a bull market that is trying to shed its excess fat. We'll be on the stocks that are making their moves.
There is no need to get cute with this market, trying to plow into stocks that are extended or short stocks anticipating a turn is downright dangerous. Carefully planned execution and picking the right spots to get long is what is warranted. I do believe this market will continue on its upward path before seeing any type of major correction. Since 7/8 Day 1 of this most recent rally attempt the market has yet to see any distribution yet it has seen more than a few accumulation days. It is this type of action that indicates to me this market will continue its upward trend.
Always remember to cut your losses, you never want losses to take out your trading capital.
FREE YouTube video for non-subscribers and Silver subscribers:
Wednesday, July 29, 2009
It Sure Is Nice To See The Market Take A Breather On Mixed Volume; Pullbacks Create Proper And Beautiful Bases
The SP-500 and the Nasdaq both pulled back today but volume was heavier on the SP-500. While that might seem bearish, and technically it is a distro day again, to the trained eye is actually another bullish intraday session.
Once again, the SP500 pulled back intraday only to reverse off the lows putting in a very respectable bullish close. This happened yesterday and it happened again today and before today and yesterday it has happened almost EVERY single day of the rally since this most recent move higher began on 7/8. Every day you can see a bullish intraday reversal.
While this is very bullish to see in a market, it is only really bullish if you are already fully long. It also matters what you are long. Right now, we still do not have ANY "PERFECT" charts to which I can put anywhere from 10% to 25% in one position. Right now, I continue to deal with speculative stocks that are either coming from short bases or bases far away from the 50 DMA. I don't mind buying bases off the 50 DMA but I sure do want to see nice big long bases.
One of my best stocks so far in this uptrend in terms of "perfection" was RINO. On 7/13 and on 7/16 I bought RINO and the second buy came with max-green BOP the whole way in the previous uptrend, in the base, and on the breakout, along with huge volume and excellent price action--plus it was from China and not the USA; a big positive when investing (isn't that sad to say, Americans). Anyways, the stock only put in an 11-day base before breaking out on 7/16. That is only two weeks and one day, everyone. The best stocks, if you go back and study my best-of-the-best past-big-winners almost all come from bases over three weeks long (most are around four-five) and/or come with price coming right off the 50 DMA. So before we see any HUGE 500% gains in 3 to 6 months kind of returns, we are going to have to see some longer/nicer bases.
Still, overall, am I going to complain about this market, after the 2008 we just had? Absolutely not. What I am doing is telling the truth. For me to "load-up" on stocks to my full margin and OPM accounts I am going to need to see better charts. Now, I hear people say (including me) that the 2008 market was so much worse than the 2002 market (obviously, since it was really only the Nassy that got trashed) market that bases are going to be uglier. That is fine but that just means that I will be risking my "I can invest this without worry" money in them. Until they make another round of bases (and if they don't that is just tough luck on my part), I can not risk OPM or my IRA money into the two-week bases or two-day bases that are making stocks move 40% in 8 days. Sorry, I can't do it.
I can play with my safe, fun money in stocks right now. Especially charts that have corporations in CHINA. If they breakout and are from China I am all over them. One of my recent large longs was CGA. 7/15 I loaded up on it. Then on 7/21 it breaks down on strong volume hitting me with a 6% loss. Three days later it was moving up 17% in one day and now is up 32% in the past four days. That is my luck everyone. However, had it not broken down, I would have done very very well based on one fact alone. It was from China. If a stock breaks out from a great base and has a wonderful chart pattern with strong fundamentals, I might or might not buy a lot of it. One way to guarantee I will: if it says it is from China. Sadly, fakeouts and breakdown re-breakouts are a part of the game and I will have to live with them. Sometimes you get faked out: CGA. Sometimes you hit it just right: RINO. Sometimes you don't have any "perfect" charts and must stay patient: now.
I have a feeling as long as the NYSE, SP500, Nasdaq, and IBD indexes act the way they do as they pullback, we can have quite a few very beautiful chart patterns to pick from and possibly finally find our "perfect" patterns that has helped me invest in some very nice winners that allowed me a very nice life in NYC and Maui from 1999-early 2007. Since then, it has been a fight. I had one subscriber make 100% shorting the same stocks I was shorting in 2008. However, I didn't return 100%. Everyone is different. Don't beat yourself up too much if you are not making money or even losing money in this market. I still am not killing it. Will I eventually? You bet your buns I will. However, I can't predict that will be. I can tell you when it will happen. When the charts start making you drool. There aren't too many that are doing that right now. So for now, I will try to make as much money as I can, while I wait for the perfect moment to setup so that I can "get rich again."
I tell you what it sure isn't cheap living on Maui, in today's economic times. It makes a whole lot of sense to move and that is what I will be doing soon. So if any of you refer to me as MauiTrader or whatever moniker I was given, start getting used to saying TexasTrader because that is where hopefully I will be at this time next year. Any of you Texas residents want to start an investing club or would like me to give seminars, I am 100% committed to being a member of the community. This is my final year on Maui. Sorry Hawaii. You are taxing me out. Aloha! I will make sure when I move that I have internet connectivity available immediately so I will not miss a beat. It is a year away but I think it is appropriate to let everyone know now. I am leaving Maui. This is my final year away from the Mainland. I put in a great 10 years here and maybe I will be back but for now I sure would like to settle, start my fund, and get a serious work environment setup so that I can help even more people become financially independent or more secure.
I'll see you tomorrow. Aloha and let's pray this market continues to stair-step higher. This Nasdaq pattern is beautiful. Now all we need is one base longer than 10 days or so. At least two FULL weeks would be nice right about now. Viva la uptrend! :)
FREE YouTube Video to teach you how to read the market CORRECTLY:
SUBSCRIBERS YOU CAN VIEW THE FULL SIZE ON THE GOLD FORUMS
Tuesday, July 28, 2009
Another Very Mellow Intraday Session Ends With Indexes Mixed On Higher Volume; Volume Continues To Be Below Average To Average
I tell you what when the market doesn't move much intraday for a long period of time it sure does get more difficult to decide what you want to talk about. However, I really don't think that there is much you can talk about except for one thing: for a market moving up in such a slow steady fashion, nothing is steady about this market. First case in point you can refer to USU and the second case in point you can refer to UTA.
First off, USU got crushed, for a good reason. However, in a bull market you normally don't see these type of destructive reactions and see them so often. Remember ADY over two weeks ago or how about COT or ITLN yesterday. This action along with USU sure does make it hard to believe I am in a bull market. Do you think I saw this in 1999, 2003, or really anytime from 2004-2007 (early 2007 as around mid-year the fakeout breakouts started showing up)? If you said no, you are right. This was not normal. In fact it is not normal to have rallies with this many DISASTERS and you can be sure that is what these are disasters. Luckily, for once, for me, I have not been hit by any disasters that crush my accounts. Instead I continue to find my way into mediocre picks that don't do much (at least it makes me money) but at least keep me from having a heart attack.
While all of this goes on, I am out there with my eye on some possible beautiful buys. The problem is though, historically, you must wait for a base, setup, and breakout. Well right now we don't get a base or setup. We just get breakouts. Case in point with UTA. UTA is a stock that I have been watching since it made its way to the Nasdaq. Shortly after being listed it started rising on strong volume with green BOP. In June after the initial rally it pulled back on lower volume to beautiful support that then saw it take off 38% in 3 days on strong volume. This got my eyes on it hard. Now I want to buy the breakout. As I watch it base all looks well until 7/20. On 7/20 the stock decides to make the right side of its base all in ONE DAY. While it did not complete the right side, it was still up over 19%, putting it in a position of extreme overbought. What followed was very well received by me as it went sideways for five days. Sadly during those five days it did have two heavier volume reversals that sent BOP back to yellow. However, before the fifth day hit it was back to green BOP. Basically, the base was looking good. Then all of a sudden today the darn stock shoots up over 20% in one day. If you were following the stock intraday, you more than likely were able to buy near the pivot and now have a wonderful little gain in a HOT stock. However, if you are like me and unable to watch intraday you are now sad that your breakout went too far too fast. Welcome to our new stock market of 2009!
Never fear though, everyone, I do have a plan to get myself long before it is too late but it must do one of two things. It must either now reset up in a nice base on base pattern with this next base coming on green BOP and quiet volume the entire way or I would LOVE to see a low volume pullback to near the 12.50-12.75 area. If it can pullback to that area on lower volume, keep its BOP max-green or even just green, and then bounce off that area on strong volume, I wouldn't mind getting long heavy at all. So at least I have a plan to get that stock if it wants me to have it. If it doesn't pullback or if it doesn't setup in another base well then I will just have to say congratulations to everyone. I will get the next one.
I tell you what, though, this sure is one of the FIRST UPTRENDS I have EVER seen without any green to max-green BOP filled bases on lower volume with flat tight price action that led to breakouts on strong volume with max-green BOP, the good news is that some money is still able to be made. Especially on some of the more random stocks like AVNR, ISTA, CHLN, or SCLN. If you are not making some money, you are not cutting your losses fast enough. This market should be able to offer everyone a chance to make at least a little bit of money as long as you are fast at killing what doesn't work and move on to what does. At the same time, if you still are not making money, DO NOT BEAT YOURSELF UP. Like I just said I have not seen an uptrend that has lasted longer than a few months go this long without building any green to max-green BOP filled gems that come with a high-quality stock in regards to EPS/sales. So don't beat yourself up. Trust me, if this was 2003, you would all have a gain of 500%. However, some of you might have gains of 200%. Would you still be pissed off at some one else for having a 700% return. I hope not. Some will be up 100% since March and more will be up 20%. In 1999 some were up 1,000% and some were up 200%. No matter what it is some people will never be happy. So don't waste too much of your time being mad at the "CRAZY!!!!" market. Who would have known a POS-type stock like AVNR would rock a stock like ARST.
Not a lot makes sense which is why cash is still one of my best friends. When the TASR and EPIC charts of 2003 are ready for me, you KNOW I will be there!
FREE YouTube video to teach you how to read the market CORRECTLY:
Monday, July 27, 2009
Constant Below Average Volume Gains Are Leading To Some Winners To Crash Hard (ie...COT); The Leading IBD Indexes Pullback, Hinting At A Tired Market
FREE YouTube Video to teach you how to interpret the market CORRECTLY:
FULL COMMENTARY WILL COME AFTER I COMPLETE MY SCANS FOR THE LIST OF NEW LONGS/SHORTS. I WANTED TO LET GOLD AND PLATINUM SUBSCRIBERS KNOW THAT THE FULL SIZE VIDEO ONE IS AVAILABLE ON THE GOLD FORUMS. IT IS A MUST WATCH SO THAT YOU CAN SEE THE DIFFERENCE BETWEEN MAKING MONEY AND NOT MAKING MONEY RIGHT NOW IS NOTHING BUT LUCK. SKILL AND PROPER ANALYSIS OF THE BEST STOCKS WITH THE BEST PATTERNS WILL NOT GUARANTEE LARGE GAINS RIGHT NOW. BASICALLY A LOT OF LUCK IS THE ONLY WAY YOU ARE GOING TO BE HITTING IT OUT OF THE PARK. THE ONLY OTHER WAY I CAN SEE TO MAKE BIG MONEY RIGHT NOW IS TO FOLLOW THE STOCKS I PUT ON MY WATCHLIST INTRADAY AND BUY THEM ON THE BREAKOUTS WITH STRONG VOLUME. I HAVE STUDIED SOME OF MY SELECTIONS WHERE THEY FLY INTRADAY AND NOTICE THAT SINCE SO MANY OF MY LONGS HAVE A HABIT OF GOING UP 20% BY THE EOD BUT BEFORE THE CLOSING BELL YOU CAN BUY THEM AROUND A SAFE 5-10% MOVE PAST THE PIVOT. SO IF YOU CAN WATCH SOME OF MY BEST PICKS ALL-DAY INTRADAY I RECOMMEND DOING THAT AND GETTING LONG THE STOCKS THAT BREAKOUT ON LARGE VOLUME WITH BEAUTIFUL GREEN TO MAX-GREEN BOP.
FULL COMMENTARY COMING UP. MAKE SURE TO WATCH VIDEO ONE NOW GOLD AND PLATINUM SUBSCRIBERS. THERE IS SOME IMPORTANT STUFF IN THERE.
Subscribe to:
Posts (Atom)